Apps log a lot of information to the debug console in Xcode which at some point might get overwhelming and makes it difficult to understand what is going on. The information of what we are interested in when debugging an app might get overflown with information coming from other parts of the app. Everyone who have worked on apps which log a lot to console are more than happy to learn that Xcode 15 finally supports filtering console logs. No need to launch the Console.app any more if we want to get filtered console logging, we can forget that workaround. Let’s dive in how structured logging works alongside with Xcode 15.
For getting the full benefit of the new Xcode 15 update, we should be using Apple’s structured logging APIs. The logging APIs got an update in iOS 14 with the introduction of a Logger type. Before that, we used to use os_log functions. Here is an example of how to use the Logger type. My personal preference has been extending the Logger type in each of the module (target) with convenient static variables, which enables auto-completion.
import os

extension Logger {
    static let subsystem = Bundle.main.bundleIdentifier!

    static let networking = Logger(subsystem: subsystem, category: "Networking")
    static let presentation = Logger(subsystem: subsystem, category: "Presentation")
}
Let’s add some logging to a view model, which in turn uses a service class to fetch statements. The prepare method is called from view’s task view modifier.
@Observable final class ViewModel {
    let service: StatementService

    init(service: StatementService) {
        self.service = service
    }

    private(set) var statements = [Statement]()

    func prepare() async {
        Logger.networking.debug("Starting to fetch statements")
        do {
            self.statements = try await service.fetchStatements()
            Logger.networking.notice("Successfully fetched statements")
        }
        catch {
            Logger.networking.error("Failed to load statements with error: \(error)")
        }
    }
}
The debug console view in Xcode 15 looks like this by default when running our sample app.

If we want to inspect a single log line then we can click on it and pressing space which opens a quick look window.

Here we can see all the metadata attached to the log. Note the subsystem and category lines, which come from the information passed into the Logger’s initializer.
Often we want to see some of this metadata directly in the debug console view. This can be configured using “Metadata Options” picker.

If we want to jump to the source file and location then we need to hover on the log line and a jump button appears in the bottom right corner – very handy.

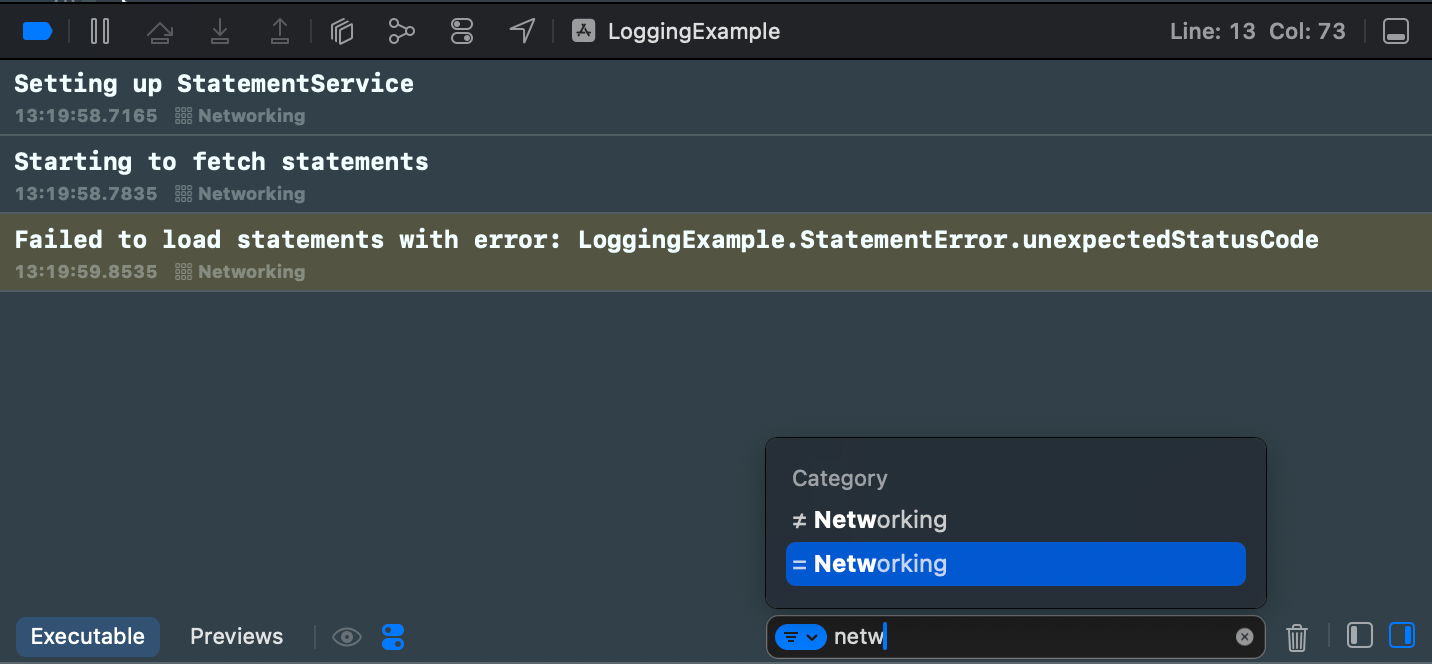
Logs can be filtered using the find bar. The find bar suggests filtering options. If I want to filter to log events which have category set to “Networking” then only thing I need to do is typing “netw” to the find bar, and already it provides me a quick way to apply this filter. Really, really handy.
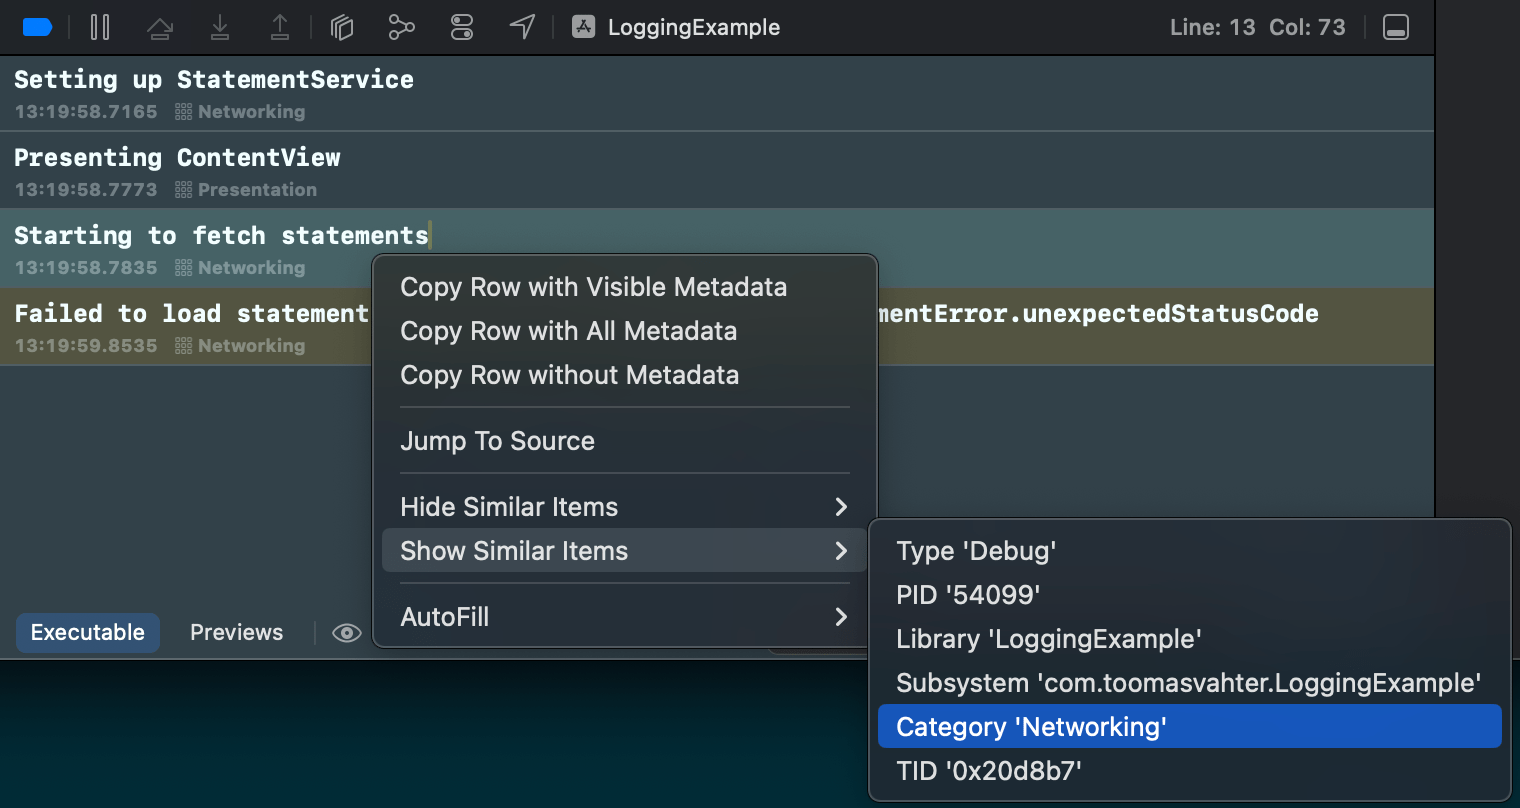
There is also a second way how to achieve the same filtering. Right-clicking a log entry and selecting Show Similar Items > Category ‘Networking’.
If this was helpful, please let me know on Mastodon@toomasvahter or Twitter @toomasvahter. Feel free to subscribe to RSS feed. Thank you for reading.
