Instruments is an application bundled with Xcode. It enables to measure application performance in variety of ways. Performance is extremely important as it keeps application responsive and in other things less CPU usage also means longer battery life. Time profiler is one of the instruments which can be used for measuring your application. What it does is that it samples the application 1000 times per second and records function backtraces in each of the sample. It gives a pretty good overview of what the application was doing when the information is aggregated. On the other hand, sampling means that we do not get full information of what was going on. We can’t distinguish if a function was running a long time, or if it was called several times when it appears in several samples.
Running an app with time profiler
When profiling an application then it is recommended to run it always on the device for accurate results. Also, we’ll need to make sure to use release configuration as it contains all the compiler optimizations and reflects the App Store build. The profile action and its configuration can be seen in Product > Scheme > Manage Schemes, selecting a scheme and clicking on the edit.

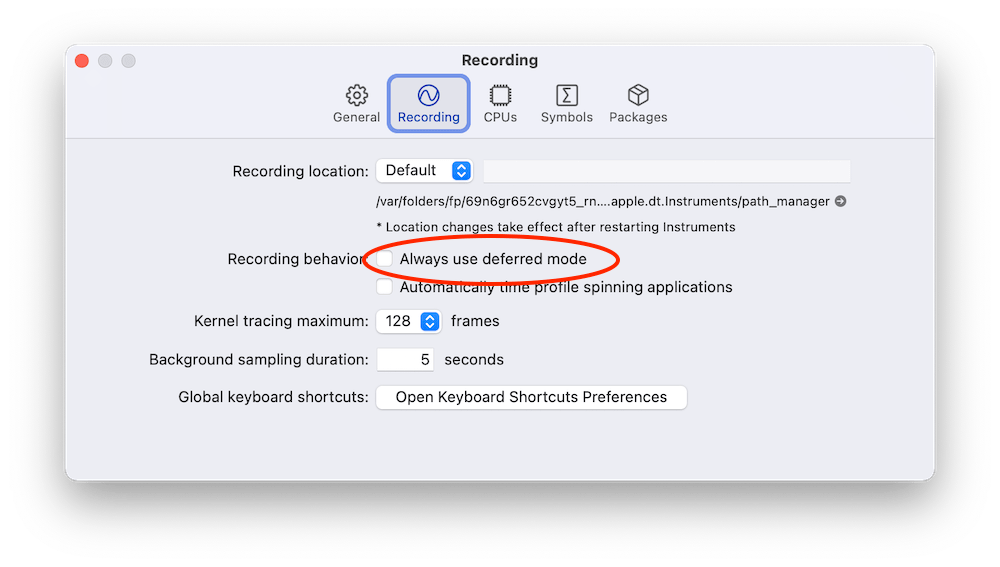
Profiling can be started with Product > Profile (command+I) which builds the application and opens Instruments. Instruments opens profiling template view where we should select Time Profiler. Clicking on the record button in the toolbar starts the application and starts profiling it. Sometimes it might be useful to enable deferred recording mode which delays the Instruments app to render recorded samples while recording is in progress. The setting for it is under Recording tab in the preferences.
Call tree view in Instruments
While the application is running it is being sampled. In every sample Instruments captures the full backtrace of every thread. Sampled data is then aggregated and can be viewed in call tree view. Just to reiterate that sampling also means that very fast functions might not show up at all as they already stopped executing before a new sample is captured. Another thing to note is that the time in the call tree view equals to the function count in samples times the sampling time. Therefore, it is not an exact duration of the function execution. Let’s take a look at an example trace.
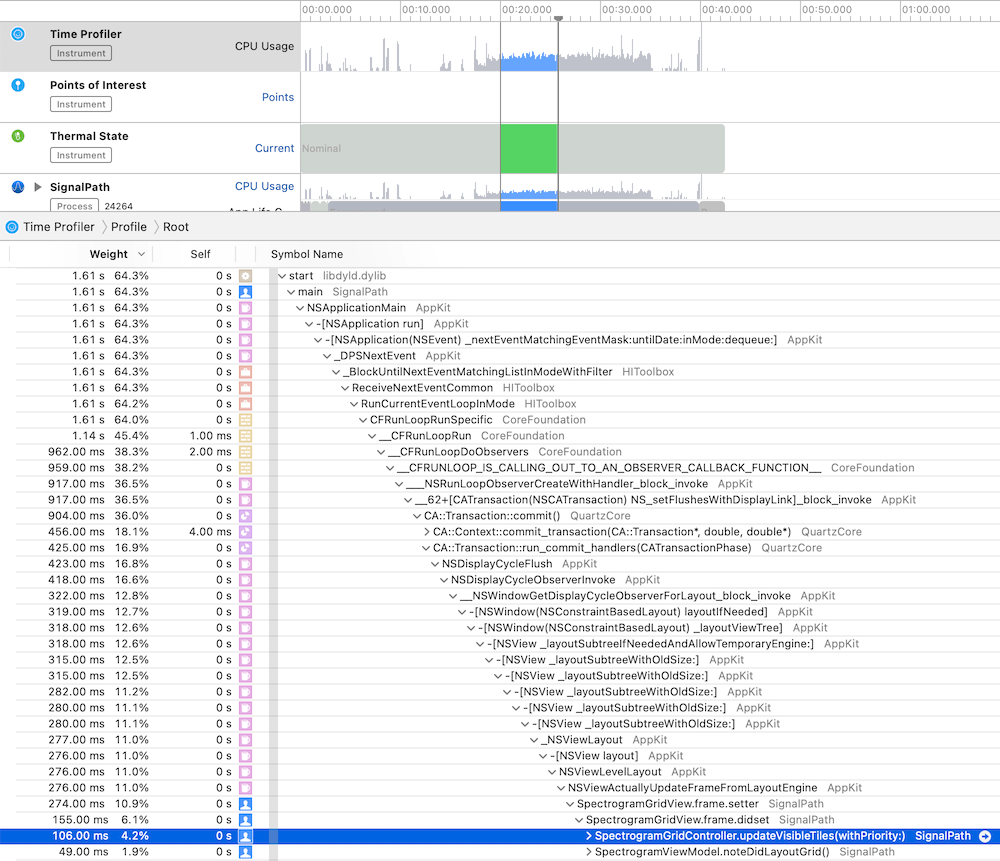
The call tree view contains several columns: weight, self and symbol name. The weight shows the percentage of samples that the particular call tree appeared in. The self column shows the time spent in that method itself. This excludes time spent in other methods it called itself. In summary, the work the method did itself. Just to reiterate, time equals to sample count times sampling time. In the symbol name column we can navigate the tree and see which methods were called. There can be a lot of information. Also, the backtrace can be pretty long. For making it easier one can hold option while clicking on disclosure triangles which will trigger a smart expansion of the related backtraces. Another thing we can do is using call tree filtering options.

“Separate by State” option divides the data into different app states: running, backgrounded etc. “Separate by Thread” shows data for every thread separately. This is on by default as this is most of the time what we want: to see what thread was doing what. “Invert Call Tree” reverses the tree view and shows backtraces which end up calling a specific method. In other words, when a function is called from several code paths, then this option enables to see all of those code paths. “Hide System Libraries” is what I typically enable for only revealing all of my own methods. “Flatten Recursion” makes recursive functions to show up once in the call stack and “Top Functions” reveals methods which require the most work.
Another useful view is the “Heaviest Stack Trace” view which displays the call stack which needed the most work.
Something to keep in mind is that from time to time we could encounter tail call elimination which is a compiler optimization. The downside is that in some cases it will make time profiler to show a function being called by a parent method of the actual calling method. In those cases we can use CFLAGS="-fno-optimize-sibling-calls" build setting which takes away the performance gain but gives more accurate backtraces. For learning more about it, I suggest watching the WWDC video Profiling in Depth which talks about it in much greater detail.
Summary
The time profiler is an excellent tool to look into the work app is doing. It gives a detail insight on the call stack level. If we know the basics of using the time profiler we can find really quickly the areas in the app which could be more performant. Better performance means less battery usage and snappier user interfaces for users.
If this was helpful, please let me know on Mastodon@toomasvahter or Twitter @toomasvahter. Feel free to subscribe to RSS feed. Thank you for reading.

One reply on “An overview of the time profiler in Instruments”
[…] An overview of the time profiler in Instruments (May 24, 2021) […]
LikeLike