Categories
Swift

Using XCTExpectFailure in XCTests

XCTExpectFailure is a function in XCTest framework which tackles the problem of managing failing tests. Test which are broken, but not ready to be fixed. An example use-case is when refactoring code which causes some tests to fail but since the whole refactoring is far for complete we might want to hold off fixing tests now because everything can change yet again. This is when we can use XCTExpectFailure function to mark the entire test or just a code block in a test as an expected failure. Every time we run tests, the test code runs but if it fails, the expected failure message is added to the test result. In addition, this failure does not fail the entire suit. This is important when there is a CI pipeline set up which requires that there are no failing tests. In reality the test is failing, but we have marked it to be OK for now. Something to keep in mind is that XCTest framework also has a XCTSkip functions. The main difference between XCTExpectFailure and XCTSkip is that the latter stops the test code execution immediately, where the former always runs the test. Therefore, XCTExpectFailure allows us to see when the test is passing again. Might be that after a lot of refactorings, the code is in a shape again where it produces expected output.

The simplest usage of XCTExpectFailure takes no arguments. If an error is thrown inside the test then the test is marked as an expected failure, but if the test does not throw any errors then XCTExpectFailure fails the test. This is due to the fact that XCTExpectFailure is strict by default strict. The strict mode means that a failure must be happening in the test or otherwise XCTExpectFailure fails the tests. When taking that refactoring example again, then that is useful for removing XCTExpectFailure calls as soon as the test starts passing. If non-strict mode is used, then the test is marked as passed if no failures are happening, although XCTExpectFailure is used within that test. An example use-case is that we’ll clean up all XCTExpectFailures at the end of the refactoring cycle when all the tests are passing again. In addition to the strict flag, there is also enabled flag which can be used for disabling the XCTExpectFailure based on environment or any other reason on run-time. Another thing what we can configure is what kind of failure is observed by passing in an issue matcher closure, where we can inspect the issue and decide if it should be considered as an expected failure or not in fine detail. An example could be that there is a very specific error thrown which we want to consider as expected failure, but all the other failures should lead to failing the test itself.

Different usages of the XCTExpectFailure are shown below.

XCTExpectFailure("Will be fixed in ticket XXX")
XCTExpectFailure("Will be fixed in ticket XXX", strict: false)
XCTExpectFailure("Will be fixed in ticket XXX", enabled: true, strict: false) {
    XCTAssertEqual(validateData(), false)
}
XCTExpectFailure("Will be fixed in ticket XXX", enabled: false, strict: false, failingBlock: {
    XCTAssertEqual(validateData(), false)
}, issueMatcher: { issue in
    issue.type == .assertionFailure
})

If this was helpful, please let me know on Mastodon@toomasvahter orĀ Twitter @toomasvahter. Feel free to subscribe to RSS feed. Thank you for reading.
Categories
iOS macOS Swift SwiftUI

Structuring platform specific code in SwiftUI

Xcode provides a cross-platform app template in SwiftUI which can be built for macOS and iOS. This template includes a Shared folder which is meant for code used both on macOS and iOS. Many SwiftUI types and functions work both on macOS and iOS but along with developing an app we’ll encounter cases where we need to specialize per platform. When I was building a multiplatform app then the very first thing I encountered was list styles. On macOS I wanted to use a different list style than on iOS (SidebarListStyle vs GroupedListStyle). Therefore, let’s take this as an example and see what are the ways how to handle this.

Compile time checks

The first way is to add compile time checks directly to the UI code. Swift provides #if os() for branching out code which should only be compiled on the specified platform. One downside of this approach is that it can make the code pretty long in the view body when we have multiple platform specific branches. In those cases, it might make sense to have separate functions which just contain the #if os() branch. But in the example below, we just have a listStyle view modifier, which is configured differently on macOS and iOS.

struct ContentView: View {
@State var items = [1, 2, 3]
var body: some View {
List {
ForEach(items, id: \.self) { item in
Text("\(item)")
}
}
#if os(macOS)
.listStyle(SidebarListStyle())
#else
.listStyle(GroupedListStyle())
#endif
}
}

Platform specific extensions

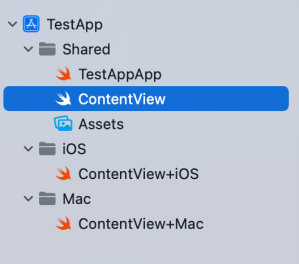
Another way for handling platform specific code is to create a separate files which are only included to platform targets. In this concrete case, those files contain a view extension and define a contentListStyle property which returns a list style. ContentView.swift file can access the property and when we are building for macOS then ContentView+Mac.swift is compiled and when building for iOS then ContentView+iOS.swift. I would recommend creating separate folders for platform specific code. For example, the project folders could be Shared, Mac, and iOS. Separate folders give a clear overview where the platform specific code is.

struct ContentView: View {
@State var items = [1, 2, 3]
var body: some View {
List {
ForEach(items, id: \.self) { item in
Text("\(item)")
}
}
.listStyle(contentListStyle)
}
}
extension ContentView {
var contentListStyle: GroupedListStyle {
return GroupedListStyle()
}
}
extension ContentView {
var contentListStyle: SidebarListStyle {
return SidebarListStyle()
}
}
Project structure in Xcode with Shared, Mac, and iOS folders for managing platform specific code.
Project structure with Shared, Mac, and iOS folders.

Summary

SwiftUI code can be shared most of the time between platforms. Sometimes we’ll need to configure the shared code per platform or use platform specific APIs. Hopefully those two approaches will give some flexibility on handling such code.

If this was helpful, please let me know on Mastodon@toomasvahter orĀ Twitter @toomasvahter. Feel free to subscribe to RSS feed. Thank you for reading.

Categories
iOS Swift

An overview of the time profiler in Instruments

Instruments is an application bundled with Xcode. It enables to measure application performance in variety of ways. Performance is extremely important as it keeps application responsive and in other things less CPU usage also means longer battery life. Time profiler is one of the instruments which can be used for measuring your application. What it does is that it samples the application 1000 times per second and records function backtraces in each of the sample. It gives a pretty good overview of what the application was doing when the information is aggregated. On the other hand, sampling means that we do not get full information of what was going on. We can’t distinguish if a function was running a long time, or if it was called several times when it appears in several samples.

Running an app with time profiler

When profiling an application then it is recommended to run it always on the device for accurate results. Also, we’ll need to make sure to use release configuration as it contains all the compiler optimizations and reflects the App Store build. The profile action and its configuration can be seen in Product > Scheme > Manage Schemes, selecting a scheme and clicking on the edit.

Xcode edit scheme view showing build configuration setting set to release
Profile action for SignalPath scheme.

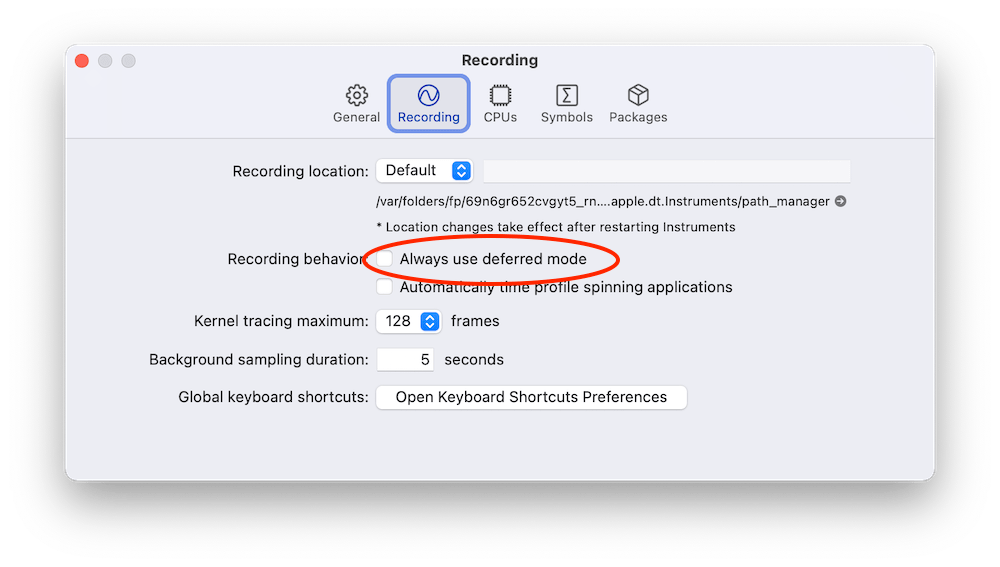
Profiling can be started with Product > Profile (command+I) which builds the application and opens Instruments. Instruments opens profiling template view where we should select Time Profiler. Clicking on the record button in the toolbar starts the application and starts profiling it. Sometimes it might be useful to enable deferred recording mode which delays the Instruments app to render recorded samples while recording is in progress. The setting for it is under Recording tab in the preferences.

Always use deferred mode in Instruments preferences
The setting for deferred mode in Instruments preferences.

Call tree view in Instruments

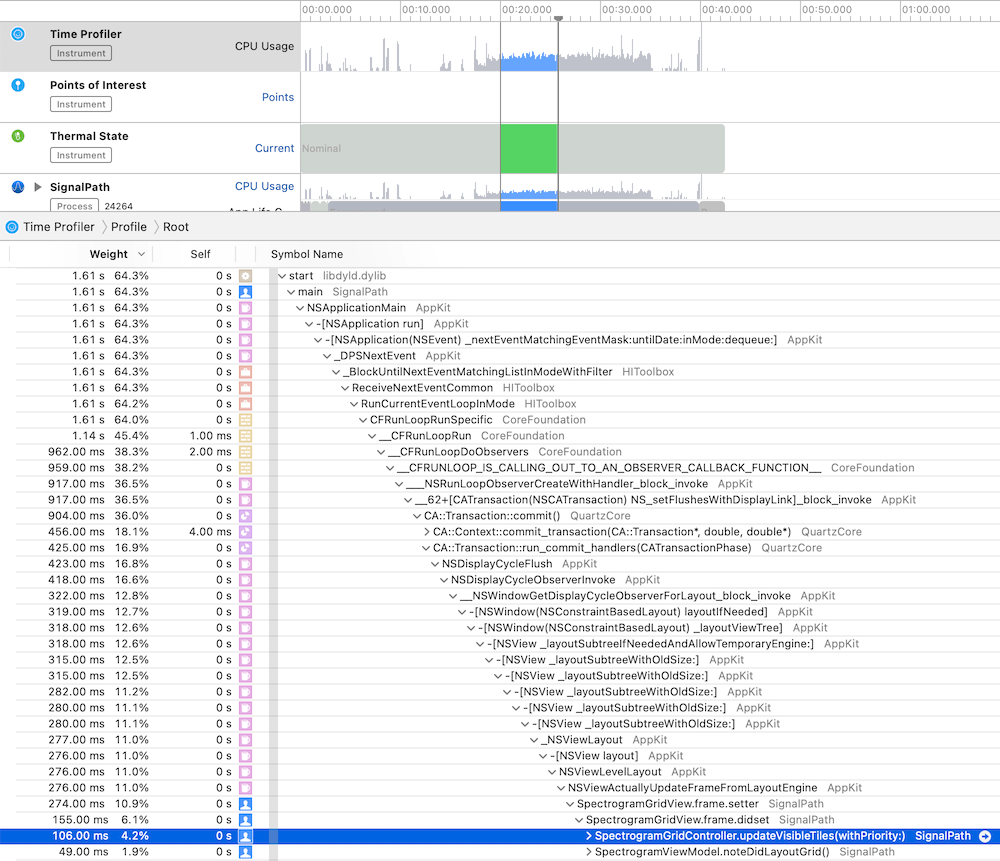
While the application is running it is being sampled. In every sample Instruments captures the full backtrace of every thread. Sampled data is then aggregated and can be viewed in call tree view. Just to reiterate that sampling also means that very fast functions might not show up at all as they already stopped executing before a new sample is captured. Another thing to note is that the time in the call tree view equals to the function count in samples times the sampling time. Therefore, it is not an exact duration of the function execution. Let’s take a look at an example trace.

Call tree view in Instruments
Call tree view in Instruments.

The call tree view contains several columns: weight, self and symbol name. The weight shows the percentage of samples that the particular call tree appeared in. The self column shows the time spent in that method itself. This excludes time spent in other methods it called itself. In summary, the work the method did itself. Just to reiterate, time equals to sample count times sampling time. In the symbol name column we can navigate the tree and see which methods were called. There can be a lot of information. Also, the backtrace can be pretty long. For making it easier one can hold option while clicking on disclosure triangles which will trigger a smart expansion of the related backtraces. Another thing we can do is using call tree filtering options.

Call tree filtering options in Instruments
Call tree options.

“Separate by State” option divides the data into different app states: running, backgrounded etc. “Separate by Thread” shows data for every thread separately. This is on by default as this is most of the time what we want: to see what thread was doing what. “Invert Call Tree” reverses the tree view and shows backtraces which end up calling a specific method. In other words, when a function is called from several code paths, then this option enables to see all of those code paths. “Hide System Libraries” is what I typically enable for only revealing all of my own methods. “Flatten Recursion” makes recursive functions to show up once in the call stack and “Top Functions” reveals methods which require the most work.

Another useful view is the “Heaviest Stack Trace” view which displays the call stack which needed the most work.

Something to keep in mind is that from time to time we could encounter tail call elimination which is a compiler optimization. The downside is that in some cases it will make time profiler to show a function being called by a parent method of the actual calling method. In those cases we can use CFLAGS="-fno-optimize-sibling-calls" build setting which takes away the performance gain but gives more accurate backtraces. For learning more about it, I suggest watching the WWDC video Profiling in Depth which talks about it in much greater detail.

Summary

The time profiler is an excellent tool to look into the work app is doing. It gives a detail insight on the call stack level. If we know the basics of using the time profiler we can find really quickly the areas in the app which could be more performant. Better performance means less battery usage and snappier user interfaces for users.

If this was helpful, please let me know on Mastodon@toomasvahter orĀ Twitter @toomasvahter. Feel free to subscribe to RSS feed. Thank you for reading.
Categories
Foundation iOS macOS Swift

Measurement, Unit, Dimension, and MeasurementFormatter on iOS

I was looking at formatters provided by Foundation framework and this time I would like to put some attention on MeasurementFormatter. Like the name says, it is used for creating localized strings of some sort of measurements. Measurements are represented by a generic struct Measurement where the generic UnitType describes the unit represented by it. Apple provides an Unit subclass Dimension which in turn has a many subclasses on its own. At the time of writing there are 22 dimensional units available with each of those having multitude of related units. For example, UnitDuration provides units for seconds, minutes, and hours. The full list of Apple provided dimensions are available in a table here: Dimension.

Using MeasurementFormatter

MeasurementFormatter is simple to use. If we change the unitStyle property then we can configure how the unit is spelled in the localized string.

let formatter = MeasurementFormatter()
let unitStyles: [Formatter.UnitStyle] = [.short, .medium, .long]
for unitStyle in unitStyles {
formatter.unitStyle = unitStyle
let measurement = Measurement(value: 9.8, unit: UnitAcceleration.gravity)
print(formatter.string(from: measurement))
}
// Prints:
// 9.8Gs
// 9.8 G
// 9.8 g-force
Basic usage of MeasurementFormatter.

MeasurementFormatter also has an unitOptions property which controls the way how the final string is composed when taking account the current locale. For example, if locale is set to en_US then UnitTemperature measurement is formatted in Fahrenheits. If locale is set to en_GB then the measurement returns Celsius.

let formatter = MeasurementFormatter()
formatter.locale = Locale(identifier: "en_US")
print(formatter.string(from: Measurement(value: 293, unit: UnitTemperature.kelvin)))
// 67.73°F
formatter.locale = Locale(identifier: "en_GB")
print(formatter.string(from: Measurement(value: 293, unit: UnitTemperature.kelvin)))
// 19.85°C
MeasurementFormatter selecting output unit based on the locale.

In case we would like to make sure the same unit is used, then we can use the providedUnit option.

let formatter = MeasurementFormatter()
formatter.unitOptions = [.providedUnit]
formatter.locale = Locale(identifier: "en_US")
print(formatter.string(from: Measurement(value: 293, unit: UnitTemperature.kelvin)))
// 293 K
Forcing the formatter to use the provided unit.

Another thing to note is that the Measurement type also supports comparing measurements and mathematical operations. For example, we can add two measurements.

let measurement1 = Measurement(value: 3.2, unit: UnitElectricCurrent.amperes)
let measurement2 = Measurement(value: 0.02, unit: UnitElectricCurrent.kiloamperes)
print(measurement1 + measurement2)
// 23.2 A
A sum of two measurements.

Creating additional units

MeasurementFormatter is built in a way that it can support custom units as well. We could create a pseudo unit for a children’s game named UnitBanana.

class UnitBanana: Dimension {
override static func baseUnit() -> Self {
return UnitBanana.banana as! Self
}
static let banana = UnitBanana(symbol: "bana", converter: UnitConverterLinear(coefficient: 1.0))
}
let formatter = MeasurementFormatter()
formatter.unitOptions = .providedUnit
print(formatter.string(from: Measurement(value: 2, unit: UnitBanana.banana)))
// 2 bana
Pseudo-unit called UnitBanana.

Summary

MeasurementFormatter and Measurement types create a powerful combination which can be used for creating localized strings of values with an unit. Next time when you need to present a value with an unit, then check out the MeasurementFormatter first.

If this was helpful, please let me know on Mastodon@toomasvahter orĀ Twitter @toomasvahter. Feel free to subscribe to RSS feed. Thank you for reading.
Categories
AppKit iOS macOS SignalPath Swift SwiftUI UIKit

Signal Path 2.0 for iOS and macOS is available now!

I am happy to announce that Signal Path 2.0 is available now for macOS and iOS. Signal Path uses Apple’s universal purchase offering – buy it once for both platforms.

Signal Path 2.0 on the App Store

Past, present, and future

I spent a lot of time architecting both apps in a way that they reuse as much functionality as possible: from Metal pipelines to view models powering the UI. Most of the UI is written in SwiftUI, but there are a couple of views using UIKit (iOS) and AppKit (macOS) directly. Now when the groundwork is done, every next release will offer the same core functionality on both platforms and also integrating OS specific features. Future is bright, give Signal Path a try!

What is Signal Path

Signal Path is the most performant spectrum viewing app with beautiful user interface. You can record audio spectrums using microphone or open large recordings containing I/Q data. Read more about Signal Path.

Categories
Metal

Processing data using Metal

Metal framework on Apple devices provides a way of using GPU for running complex computing tasks much faster than on CPU. In this blog post I am giving a quick overview how to set up a Metal compute pipeline and processing data on the GPU.

Metal compute kernel

As a first step we need to create a metal compute kernel which will run on the GPU. In this example project it is going to be very simple and just multiplies input data with a factor of 2.

kernel void processData(const device float *inVector [[ buffer(0) ]], device float *outVector [[ buffer(1) ]], uint id [[ thread_position_in_grid ]])
{
float input = inVector[id];
outVector[id] = input * 2.0;
}
view raw Compute.metal hosted with ❤ by GitHub

Compute kernel is written in Metal shading language. In the current example we first need to give name to the function and then specify arguments where the first argument is a constant float vector and the second argument is output float vector what we are going to mutate. Third argument is a thread’s position in the input vector. When running compute kernel there are multiple threads processing the input data and this tells us which element we should be modifying.

Setting up Metal compute pipeline

For running the created compute kernel on the GPU we need to create a compute pipeline what uses it.

init()
{
guard let device = MTLCreateSystemDefaultDevice() else { fatalError("Metal device is not available.") }
self.device = device
guard let commandQueue = device.makeCommandQueue() else { fatalError("Failed creating Metal command queue.") }
self.commandQueue = commandQueue
guard let library = device.makeDefaultLibrary() else { fatalError("Failed creating Metal library.") }
guard let function = library.makeFunction(name: "processData") else { fatalError("Failed creating Metal function.") }
do
{
computePipelineState = try device.makeComputePipelineState(function: function)
}
catch
{
fatalError("Failed preparing compute pipeline.")
}
}

Note that Apple recommends to create and reuse Metal objects where possible. With that in mind, we first create MTLDevice what represents a single GPU. Followed by MTLCommandQueue what is a serial queue handling command buffers GPU executes (more about that later). The third step is to allocate MTLLibrary, find the MTLFunction representing the created compute kernel and then finally initializing MTLComputePipelineState with that function. Now we have everything set up for using the created compute kernel.

Running Metal compute pipeline

func process(data: ContiguousArray<Float>) -> ContiguousArray<Float>
{
let dataBuffer = data.withUnsafeBytes { (bufferPointer) -> MTLBuffer? in
guard let baseAddress = bufferPointer.baseAddress else { return nil }
return device.makeBuffer(bytes: baseAddress, length: bufferPointer.count, options: .storageModeShared)
}
guard let inputBuffer = dataBuffer else { return [] }
guard let outputBuffer = device.makeBuffer(length: inputBuffer.length, options: .storageModeShared) else { return [] }
guard let commandBuffer = commandQueue.makeCommandBuffer() else { return [] }
guard let commandEncoder = commandBuffer.makeComputeCommandEncoder() else { return [] }
commandEncoder.setComputePipelineState(computePipelineState)
commandEncoder.setBuffer(inputBuffer, offset: 0, index: 0)
commandEncoder.setBuffer(outputBuffer, offset: 0, index: 1)
let threadsPerThreadgroup = MTLSize(width: 10, height: 1, depth: 1)
let threadgroupsPerGrid = MTLSize(width: data.count / threadsPerThreadgroup.width, height: threadsPerThreadgroup.height, depth: threadsPerThreadgroup.depth)
commandEncoder.dispatchThreadgroups(threadgroupsPerGrid, threadsPerThreadgroup: threadsPerThreadgroup)
commandEncoder.endEncoding()
commandBuffer.commit()
commandBuffer.waitUntilCompleted()
let outputPointer = outputBuffer.contents().assumingMemoryBound(to: Float.self)
let outputDataBufferPointer = UnsafeBufferPointer<Float>(start: outputPointer, count: data.count)
return ContiguousArray<Float>(outputDataBufferPointer)
}

Let’s now take a look on the process data function what takes in a contiguous float array and returns an array with values processed by a GPU. Exposing data to GPU is managed by MTLBuffer. ContiguousArray stores its elements in a contiguous region of memory, therefore we can access the contents of memory directly and create an instance of MTLBuffer containing a copy the float array.
Another instance of MTLBuffer is needed for storing the output values.
MTLCommandBuffer is a buffer for containing encoded commands what in turn are executed by the GPU. So in finally we can create a MTLComputeCommandEncoder object referencing input and output data buffer and the compute kernel. This is the object actually defining the work we want to run on the GPU. For that we first set the compute pipeline state what stores the information about our compute kernel, followed by setting data buffers. Note that index 0 is the first buffer in the kernel’s implementation const device float *inVector [[ buffer(0) ]] what defines the input and index 1 is the second buffer device float *outVector [[ buffer(1) ]] for output.
Calculating threadgroup and grid sizes contains a detailed information how to manage the amount of threads processing the data. When this is set, we mark command encoder ready, commit the buffer for GPU to execute and then waiting it to finish. When command buffer has finished we can access the data in the output buffer.

For more detailed information please go to Apple’s documentation for Metal.

Check out the whole sample application written in Swift 4 here: MetalCompute at GitHub. Make sure running it on iOS device, not in simulator.